One dashboard for a client's whole health story.
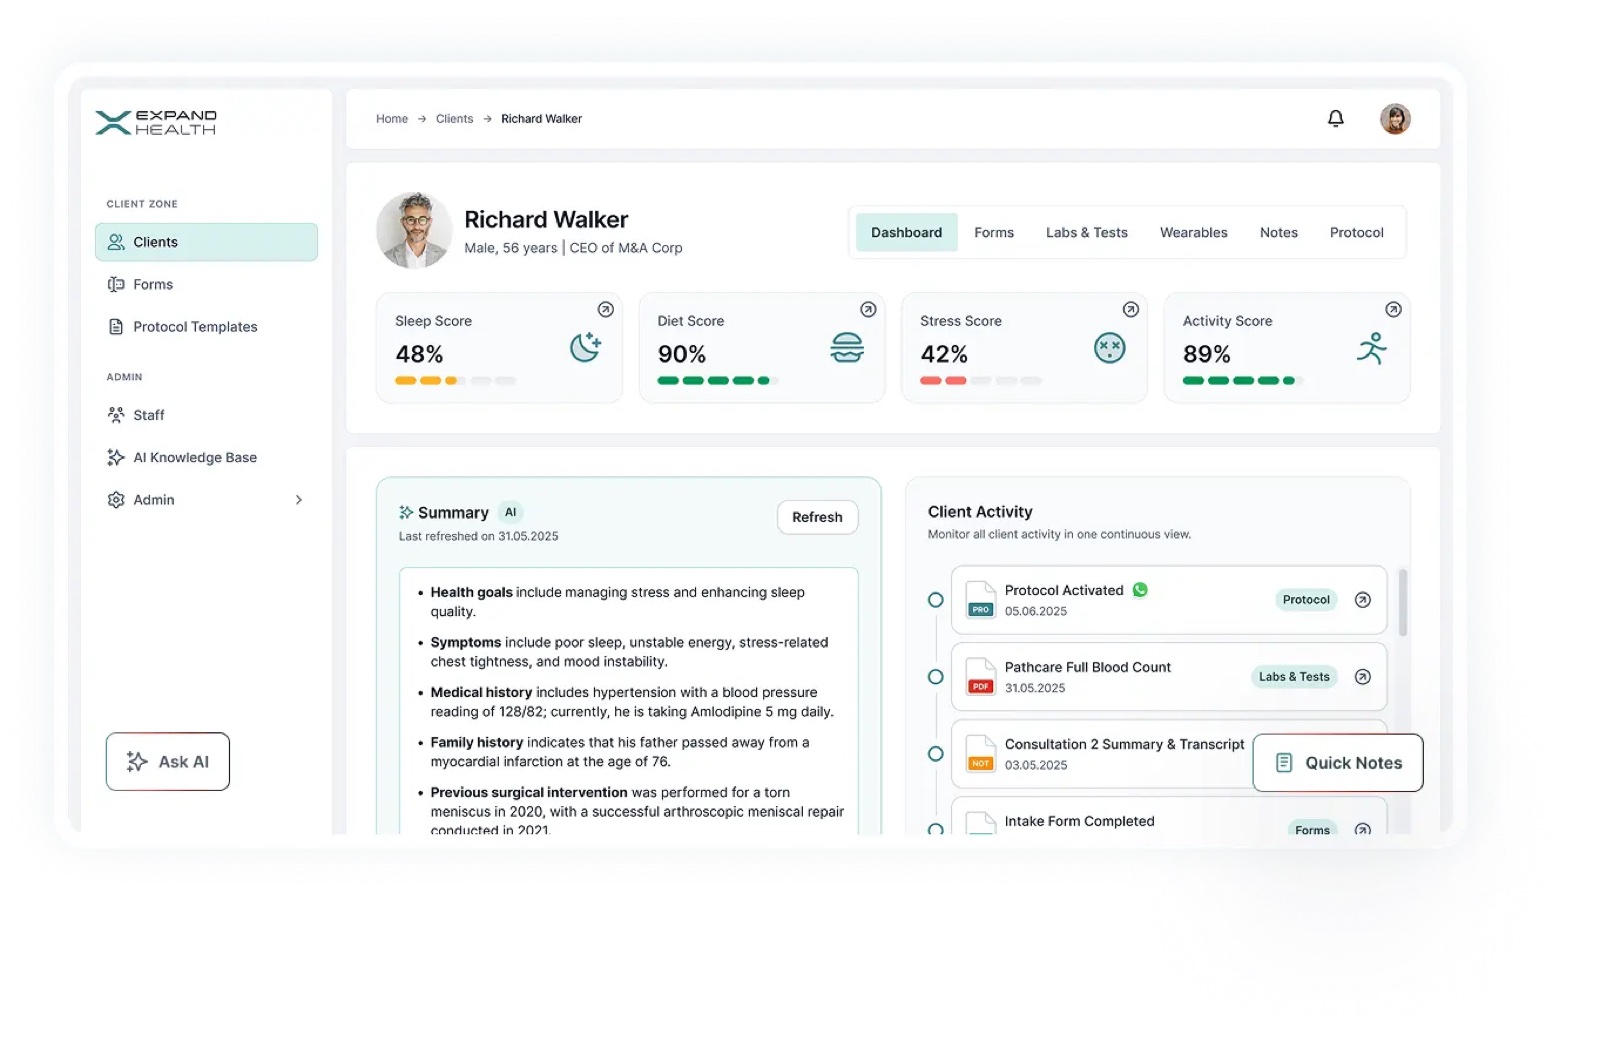
Expand Health is an AI co-pilot for longevity doctors and wellness coaches. Wearables, lab results, lifestyle data, and clinical notes flow into one place, and the AI turns them into summaries, health scores, and personalised protocols.
I was the sole designer on an 8-person team, covering the full platform: client dashboards, protocols, forms, labs, wearables, notes, staff management, and the AI knowledge base. Mid-project, scope grew to the Southeast Asia market launch, which I designed and built in Framer.
A practitioner managing 20+ clients cannot re-read a full history before every session. The dashboard leads with four scores (sleep, diet, stress, activity) and an AI summary that compresses goals, symptoms, and history into a 30-second read. Detail lives one click deeper, never gone, just not shouting.

The trickiest design problem: comparing biomarkers across a client's history in one view, so a practitioner can spot that HRV drops every time sleep quality falls, without the screen becoming a spreadsheet.
The answer was progressive disclosure. Show the most important correlation first, default to a handful of biomarkers, and let the practitioner pull more on demand. Dense, clinically important data that still reads at a glance: that is the whole craft of health UX.
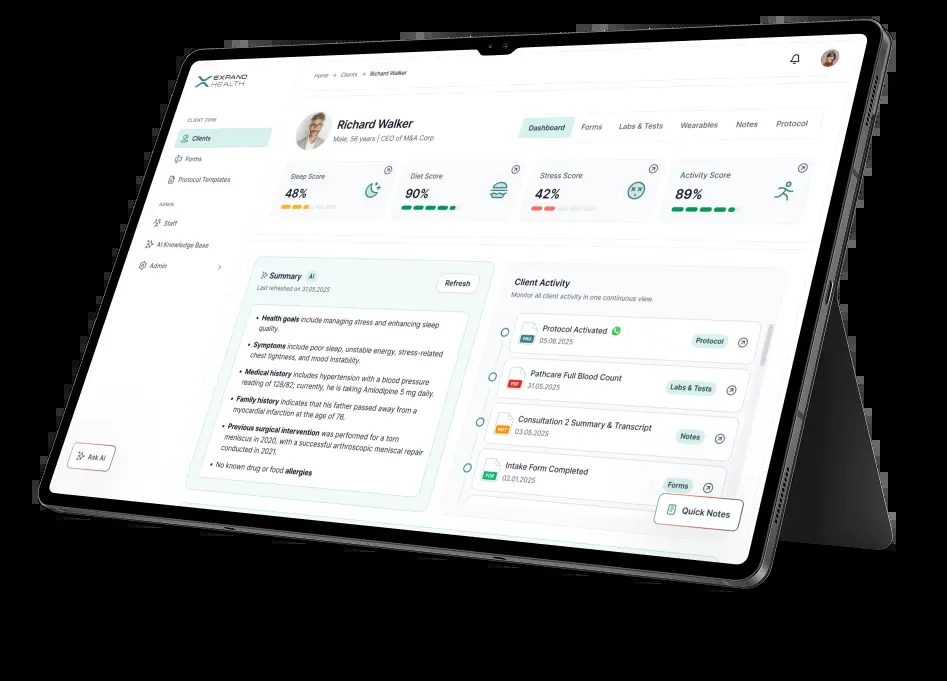
The end-to-end interactive Figma prototype did more than guide the build: the founders used it to present to investors. The engagement ended with an appreciation certificate and a client who specifically called out how easy the collaboration was.